Computational Electrochemistry

From Electrons to Energy:
Understanding Catalytic Surfaces

A scientific journey through density functional theory, surface thermodynamics, statistical simulation, and machine learning — applied to the grand challenge of green hydrogen production.

Green Energy & Water Electrolysis


The transition to renewable energy requires efficient storage technologies. Water electrolysis — splitting H₂O into hydrogen and oxygen using electricity — is a cornerstone of this transition. Understanding and optimizing the underlying catalytic reactions is a central scientific challenge.
Water electrolysis electrodes with H₂ and O₂ bubble formation

The Energy & Climate Challenge

Despite scientific consensus on anthropogenic climate change, global energy production in 2019 still relied overwhelmingly on fossil fuels. Atmospheric CO₂ concentrations are at historic highs — a trend confirmed by Antarctic ice-core records stretching back 800,000 years.

Renewable sources (solar, wind, hydro) are growing rapidly, but their intermittent nature creates a fundamental challenge: energy must be stored when supply exceeds demand and released when it does not.

  • Electrochemical storage offers high energy density and scalability
  • Hydrogen gas is a clean energy vector when produced electrolytically
  • Round-trip efficiency depends critically on catalyst overpotential
  • Li-ion batteries, pumped hydro, and H₂ each cover different power/capacity regimes

Energy Storage Technologies

Pumped HydroLarge scale, geographic constraints
Hydrogen (H₂)High density, flexible deployment
Li-ion BatteriesFast response, moderate scale
Compressed AirGeological formations required

Relative capacity/applicability of current storage technologies

Relative suitability of energy storage technologies by scale and deployment flexibility

Water Electrolysis

First demonstrated in 1789 by van Troostwijk and Deiman, water electrolysis decomposes liquid water into gaseous hydrogen and oxygen using electrical energy. The thermodynamic requirement is 2.46 eV per water molecule (237.2 kJ/mol), corresponding to 1.23 V per electron transfer.

\[ \mathrm{H_2O} \;\longrightarrow\; \mathrm{H_2} + \tfrac{1}{2}\mathrm{O_2} \qquad \bigl(\Delta G = 237.2\,\mathrm{kJ\,mol^{-1}}\bigr) \]

The overall reaction proceeds through two half-cell reactions at the electrodes:

Cathode (HER)

4H⁺ + 4e⁻ → 2H₂

Low overpotential on most metals

Anode (OER)

2H₂O → O₂ + 4H⁺ + 4e⁻

Rate-limiting step, high overpotential

Cyclic voltammetry curve and electrode schematic

Schematic CV showing anodic (blue) and cathodic (orange) sweeps with characteristic peaks

OER Kinetics & the Volcano Plot

The oxygen evolution reaction (OER) involves four sequential proton-coupled electron transfers, each ideally requiring 1.23 V. Any additional voltage needed — the overpotential η — represents an energy loss.

The four-step OER mechanism on a metal oxide surface:

H₂O + * → *OH + H⁺ + e⁻

Water dissociation and OH adsorption

*OH → *O + H⁺ + e⁻

Dehydrogenation to adsorbed oxygen

*O + H₂O → *OOH + H⁺ + e⁻

Often the rate-limiting step on most catalysts

*OOH → O₂ + H⁺ + e⁻ + *

Desorption regenerates surface site

Key insight: Each step involves a proton-coupled electron transfer. The *OH → *O and *O → *OOH transitions determine the theoretical overpotential. A perfect catalyst would drive each step at exactly 1.23 V.

The hydrogen evolution reaction (HER) is simpler — a two-step Volmer–Heyrovsky or Volmer–Tafel mechanism — and proceeds with much lower overpotential on most metallic catalysts.

The Brønsted–Evans–Polanyi (BEP) relation states that kinetic barriers for surface reactions scale linearly with adsorption energies. This allows us to compute theoretical overpotentials from DFT adsorption energies alone — orders of magnitude faster than computing full transition states.

\[ E_a \;=\; \alpha \cdot \Delta E_\mathrm{ads} + \beta \qquad \text{(BEP relation)} \]

Assuming BEP scaling holds, the descriptor ΔG*O − ΔG*OH captures the competition between oxygen binding strength (too strong → *OOH formation limited) and too-weak binding (→ *OH dehydrogenation limited).

📄
Thesis reference: Chapter 4 presents computed OER overpotentials for IrO₂ and Ti–IrO₂ alloy surfaces using this BEP framework, with explicit DFT adsorption energies for *OH, *O, and *OOH intermediates.

Plotting theoretical overpotential against the OER descriptor (ΔG*O − ΔG*OH) for a range of transition metal oxides produces the characteristic volcano plot. Materials at the peak — IrO₂ and RuO₂ — bind oxygen intermediates optimally.

  • Left flank: Strong O binding — *OOH formation is rate-limiting
  • Right flank: Weak O binding — *OH → *O dehydrogenation is rate-limiting
  • Volcano peak: IrO₂ and RuO₂ achieve lowest theoretical overpotential (~0.4 V)
  • TiO₂: Located far right — too weak O binding, η ≈ 1.2 V
Design strategy: Alloying IrO₂ with Ti shifts the descriptor toward the volcano peak, potentially improving activity while reducing the amount of scarce iridium required.

Catalyst Materials

🔬

IrO₂

Industrial gold standard for acidic OER. Binds oxygen intermediates optimally — close to the volcano peak. Stable in acidic conditions but based on scarce Ir.

⚗️

RuO₂

Slightly more active than IrO₂ but dissolves ~10× faster at 1.2 V in acidic media. Investigates as comparison material in surface phase diagram studies.

🧪

Ti–IrO₂ Alloy

Mixing Ti into the IrO₂ host can modify adsorption energies and improve OER activity. Computationally designed — DFT identifies optimal Ti motifs and surface configurations.

🌊

High-Entropy Oxides

Recent work explores multi-component oxides (5+ elements) that access vast composition spaces. ML-driven screening and in-situ XAS characterize active sites.
Density Functional Theory


Density Functional Theory provides a quantum-mechanical framework to compute the electronic structure of materials from first principles — without empirical parameters. It is the workhorse of modern computational materials science.

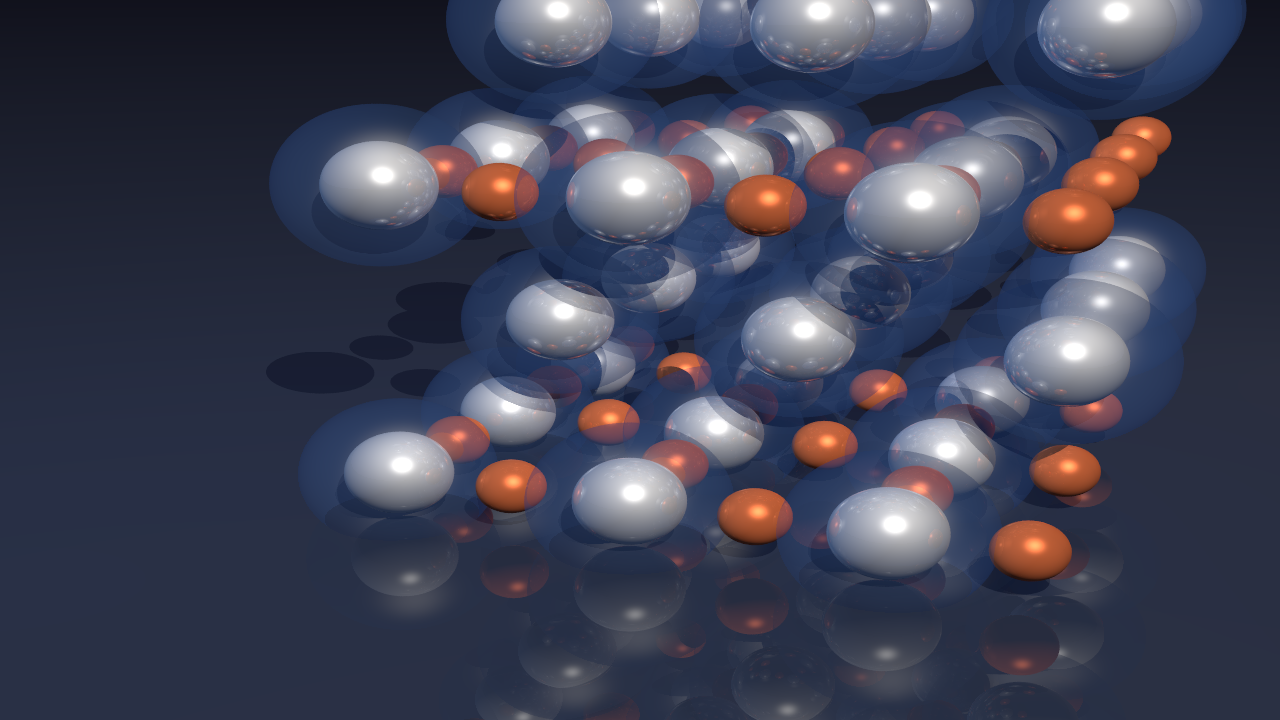
Crystal lattice with electron density clouds

Artist's rendition of a rutile-type crystal lattice with electron density clouds (blue) around metal atoms and oxygen (red)

Foundations: Hohenberg-Kohn Theorems

The first Hohenberg-Kohn theorem (1964) establishes that the ground-state electron density n(r) uniquely determines all properties of a many-electron system. The second theorem provides a variational principle: the true ground state minimizes the total energy functional E[n].

\[ E[n] \;=\; T[n] + V_\mathrm{ext}[n] + E_\mathrm{H}[n] + E_\mathrm{xc}[n] \]

Kohn and Sham (1965) reformulated the problem using a fictitious system of non-interacting electrons moving in an effective potential, making DFT computationally tractable for real materials.

📄
Thesis reference: Chapter 2 (§2.1) provides a full derivation of the Kohn-Sham equations, exchange-correlation approximations, and van der Waals corrections used throughout the computational work.

Exchange-Correlation Functionals

The exchange-correlation (XC) functional Exc[n] accounts for quantum-mechanical exchange and electron correlation effects. Its exact form is unknown; approximations form the "Jacob's Ladder" of DFT:

LDA

Local Density Approximation — uses only local electron density. Simple, systematic underbinding.

GGA / PBE

Generalized Gradient Approximation. The Perdew-Burke-Ernzerhof functional is standard for surface catalysis.

vdW-TS / DF

Van der Waals corrections (Tkatchenko-Scheffler, Dion-DF) capture long-range dispersion — critical for water and adsorbates.

Hybrid (HSE)

Mixes exact exchange — improves band gaps and electronic structure but at higher computational cost.

VASP & the Plane-Wave Basis

The Vienna Ab initio Simulation Package (VASP) solves the Kohn-Sham equations in a plane-wave basis set with periodic boundary conditions. Core electrons are treated by the Projector Augmented Wave (PAW) method, substantially reducing computational effort while maintaining accuracy.

  • Plane-wave cutoff energy controls basis set completeness
  • Monkhorst-Pack k-point grids sample the Brillouin zone
  • Methfessel-Paxton smearing handles metallic systems
  • Dipole corrections are applied for asymmetric surface slabs

Typical Setup for Oxide Surfaces

# IrO₂(110) slab parameters
ENCUT = 500 eV
KPOINTS: 4×4×1 Γ-centered
ISMEAR = 1 (Methfessel-Paxton)
GGA = PE (PBE functional)
IVDW = 11 (Tkatchenko-Scheffler)
LDIPOL = .TRUE. (dipole correction)
Slab: 4 layers, 15 Å vacuum
📄
Thesis §5.3 details the DFT convergence tests and code settings for the IrO₂ hydrogen coverage study.

Surface Science & Electrocatalysis


Electrochemical reactions occur at the interface between a solid electrode and liquid electrolyte. The atomic-scale structure of the catalyst surface — its adsorbate coverage, oxidation state, and composition — directly controls catalytic activity and stability.

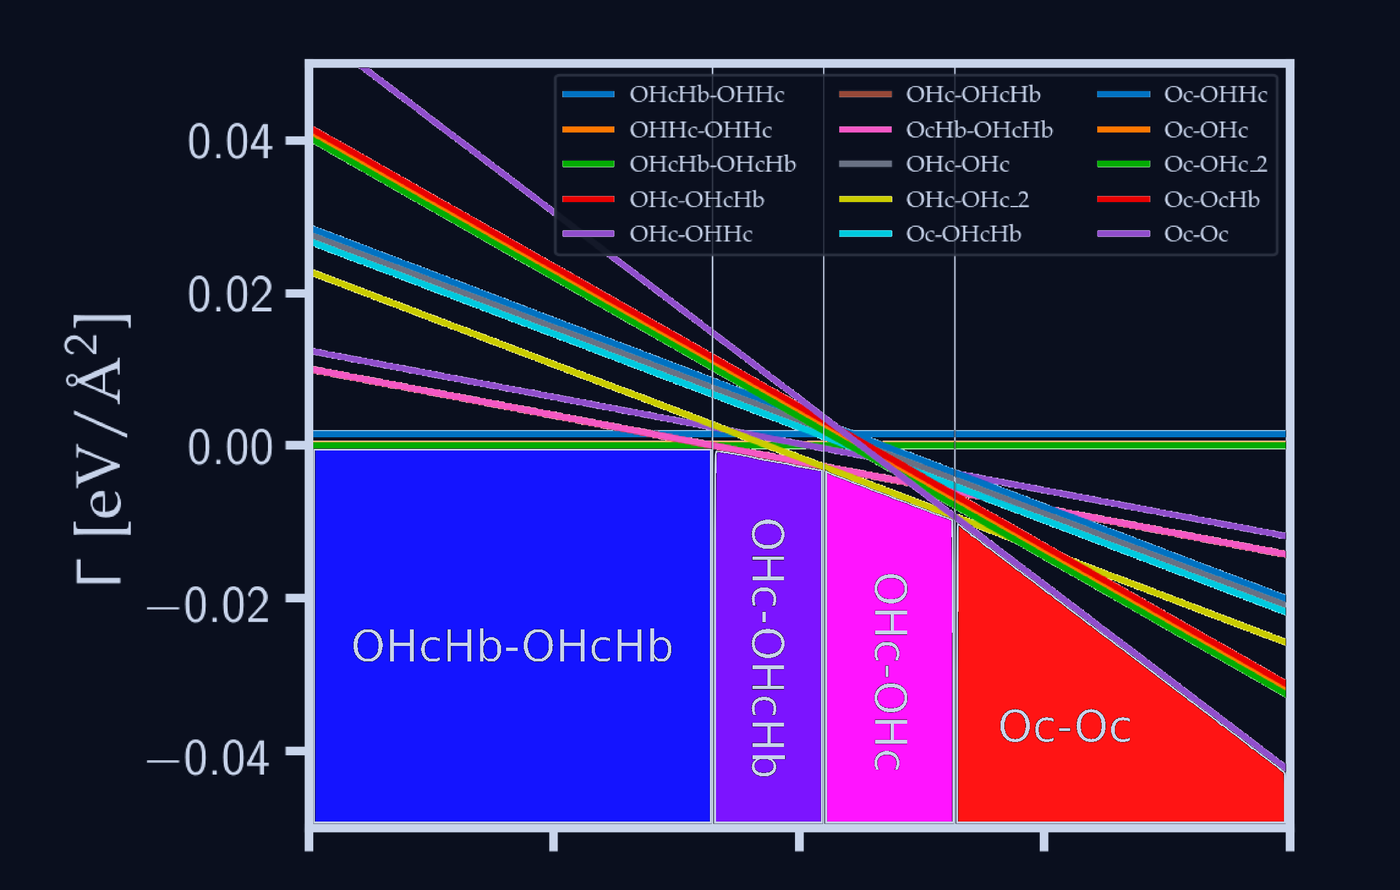
Surface phase diagram of rutile IrO₂ (110) — surface free energy Γ vs electrode potential U_RHE, showing stable hydrogen-covered phases
Surface free energy Γ [eV/Ų] as a function of electrode potential URHE [mV] for rutile IrO₂ (110). Coloured regions mark the thermodynamically stable hydrogen-coverage phases; coloured lines are individual DFT surface configurations.

Surface Phase Diagrams

Under electrochemical conditions, the surface is in thermodynamic equilibrium with the electrolyte and applied potential. The grand canonical surface phase diagram maps out which surface configuration is thermodynamically stable as a function of the chemical potential of oxygen and hydrogen.

\[ \gamma(\mu_\mathrm{O},\,\mu_\mathrm{H}) \;=\; \frac{1}{A}\!\left[G_\mathrm{slab} - N_\mathrm{Ir}\,\mu_\mathrm{Ir} - N_\mathrm{O}\,\mu_\mathrm{O} - N_\mathrm{H}\,\mu_\mathrm{H}\right] \]

The chemical potential μ_H is linked to the electrode potential via the computational hydrogen electrode (CHE) — a key bridge between DFT energies and electrochemical observables.

Computational Hydrogen Electrode (CHE):
At 0 V vs RHE and pH 0, the chemical potential of H⁺ + e⁻ equals ½μ(H₂). Shifting the potential by U simply shifts all proton-electron pairs by –eU. This allows direct comparison of DFT energies to experimental cyclic voltammetry.
  • Surface stability mapped as a function of potential and pH
  • Phase boundaries correspond to adsorption/desorption features in CV
  • Multiple surface terminations compared simultaneously
  • Solvation energies included via implicit solvent models
📄
Thesis Chapters 3 & 5: Surface phase diagrams for IrO₂(110) and RuO₂(110) are computed and directly compared to experimental CVs.

IrO₂(110) Surface

The rutile IrO₂(110) surface exposes two types of surface sites: coordinatively unsaturated (cus) Ir atoms and bridging oxygen (Obr). Under OER conditions, these sites are sequentially covered by OH and O adsorbates.

A central question is the hydrogen coverage of the surface before and during the CV measurement. Hydrogen atoms are hard to detect experimentally due to their small scattering cross-section. DFT-based phase diagrams reveal that the surface transitions through distinct hydrogen-covered states as potential is swept.

  • Cus-OH ↔ cus-O transition observed near 0.9 V vs RHE
  • Bridging O-H bonds are present at low potentials
  • Water adsorption on cus-Ir at sub-zero potentials
  • Phase diagram features align with experimental CV peaks

Rutile Structure

IrO₂ crystallizes in the rutile structure (tetragonal, space group P4₂/mnm). The (110) surface is the lowest-energy facet and the orientation grown by MBE for experimental studies. Each surface Ir atom has 5-fold coordination (vs 6-fold bulk).

Key Surface Sites

cus-Ir
5-coordinate, accepts *OH, *O, *H₂O
Obr
Bridging oxygen, can bind H

RuO₂(110) Surface

RuO₂ shares the rutile structure and exhibits similar surface chemistry to IrO₂, with slightly stronger oxygen binding. It is catalytically more active but far less stable — dissolving ~10× faster than IrO₂ at operating potentials in acidic media. The phase diagram for RuO₂ also captures the effect of explicit water adsorption and solvation corrections.

Solvation Effects

Implicit solvent models (VASPsol) shift adsorption energies of polar adsorbates like *OH and *OOH by up to 0.1–0.2 eV.

Adsorbed Water

Explicit H₂O molecules on cus sites form hydrogen-bond networks that stabilize surface *OH configurations at low potentials.

Dissolution Stability

RuO₂ dissolution becomes thermodynamically favorable at potentials >1.2 V vs RHE, limiting practical use. IrO₂ remains stable.

Ti–IrO₂ Alloy: Enhanced OER Activity

Experimental evidence shows that incorporating Ti into IrO₂ enhances OER activity compared to pure IrO₂. The mechanism for this enhancement is not immediately obvious — TiO₂ alone is a poor OER catalyst.

DFT calculations of multiple Ti substitution motifs (cus-Ir → Ti, subsurface Ti, mixed layers) reveal that specific configurations shift the oxygen adsorption energy of neighboring Ir sites toward the volcano peak.

  • Ti substitution at cus sites reduces *OH binding, helps *OOH formation
  • Subsurface Ti modifies electronic structure of surface Ir through strain and charge transfer
  • Optimal Ti:Ir ratio predicted computationally matches experimental composition
  • Results confirm activity enhancement without requiring RuO₂-level instability
📄
Thesis Chapter 4 presents the complete computational study of Ti–IrO₂ alloy surfaces: DFT motif screening, adsorption energy calculations, and comparison with experimental activity data from MBE-grown samples.

Recent Advances (2019–2024)

More recent literature (Mints et al. 2024, Ospina-Acevedo et al. 2024) extends alloying strategies to high-entropy oxides (Ru₁₋ₓMₓO₂, M = Zr, Nb, Ta) and cooperative multi-site mechanisms. In-situ XAS and SEIRAS measurements now directly probe active site structures under reaction conditions.

Statistical Methods & Simulation


Bridging the gap between DFT calculations of individual configurations and thermodynamic observables requires statistical mechanics. The cluster expansion and Monte Carlo simulation together enable prediction of equilibrium surface properties at finite temperature and electrochemical potential.

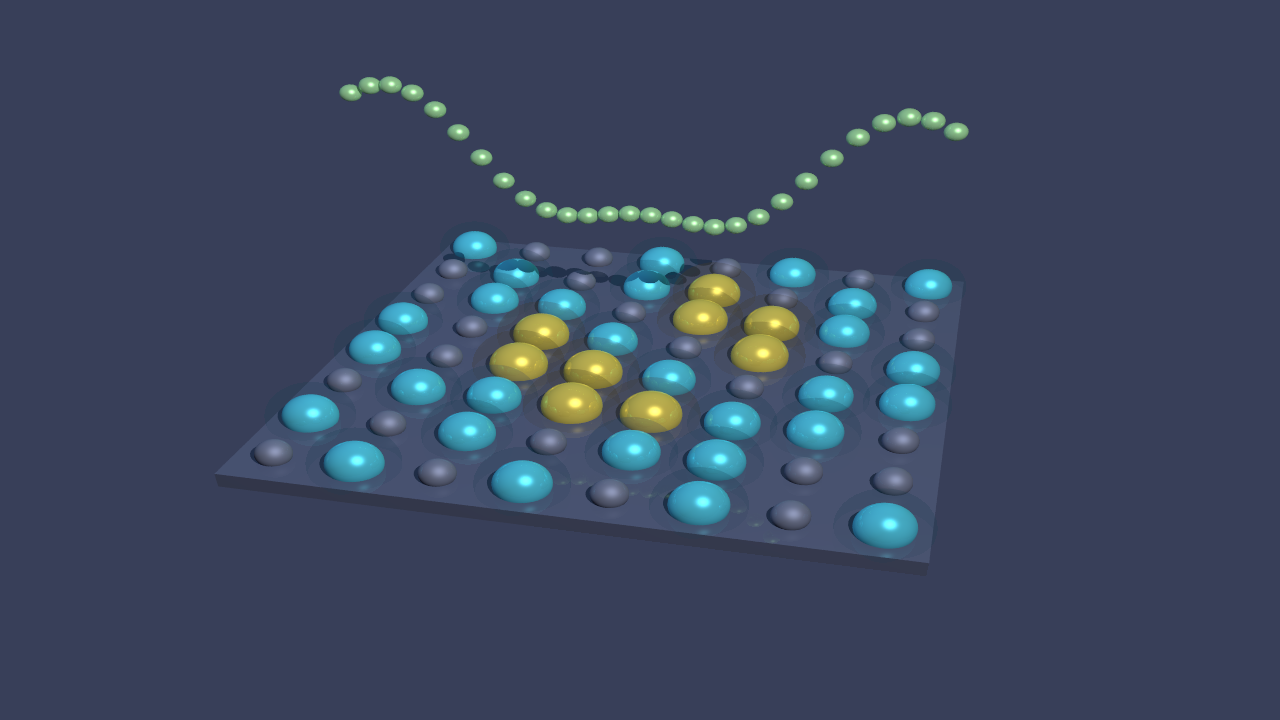
Lattice Monte Carlo simulation showing occupied (cyan/gold) and empty sites

Statistical Mechanics of Surfaces

A surface in contact with an electrolyte at fixed potential is described by the grand canonical ensemble. The grand partition function sums over all possible surface configurations weighted by their Boltzmann factor e−βΩ, where Ω = E − μN is the grand potential.

\[ \Xi \;=\; \sum_{\sigma} \exp\!\left[-\beta\!\left(E_{\sigma} - \mu_\mathrm{H}\,N_\mathrm{H}\right)\right] \]

Computing this sum exactly for a surface with N adsorption sites and k possible states per site requires kN evaluations — infeasible for large N. The cluster expansion makes this tractable.

Grand Canonical MC: Rather than enumerating all configurations, Metropolis Monte Carlo samples the ensemble by proposing random adsorption/desorption moves and accepting them with probability min(1, e−βΔΩ). Equilibrium coverage and correlations follow from time-averaged observables.

Cluster Expansion (CE)

The cluster expansion maps the DFT formation energy of any surface configuration onto a compact, rapidly-evaluable polynomial of site occupation variables σᵢ ∈ {0,1}. It is the key bridge that makes grand canonical Monte Carlo with DFT accuracy feasible.

Any configuration-dependent property can be expanded as:

\[ E(\{\sigma\}) \;=\; \sum_{\alpha} J_{\alpha} \cdot \Phi_{\alpha}(\{\sigma\}) \]

where α indexes clusters (single sites, pairs, triplets, ...), J_α are the effective cluster interactions (ECIs), and Φ_α are cluster correlation functions — products of site occupation variables for all sites in the cluster.

  • Pair interactions capture nearest- and next-nearest-neighbor effects
  • Many-body clusters (triplets, quadruplets) improve accuracy
  • ECIs encode the chemistry: sign and magnitude reflect bonding preferences

Site Occupation Variables

1
H adsorbed
0
Empty site

For the hydrogen coverage problem, each surface site is either occupied (σ=1, H present) or empty (σ=0). The CE is trained on DFT energies of ~50–200 distinct configurations.

ECIs are fitted to a database of DFT formation energies by minimizing the cross-validated prediction error (LOOCV or k-fold CV). Feature selection (which clusters to include) is guided by genetic algorithms or compressive sensing.

  • Training set: ~50–200 DFT configurations with varied coverage and patterns
  • Cluster selection: physical intuition + CV score minimization
  • Validation: leave-one-out cross-validation (CV score <10 meV/site)
  • Sparsity: few clusters needed — physics is local
📄
Thesis Chapter 5 (§5.7): Describes the cluster selection, DFT training set generation, and cross-validation procedure for the IrO₂ hydrogen CE. Pair and triplet interactions up to 3rd nearest-neighbor were included.

CASM (Crystal Alloy Structure Maker) is an open-source framework implementing the complete cluster expansion workflow: structure enumeration, symmetry analysis, CE fitting, and grand canonical Monte Carlo sampling.

  • Handles arbitrary lattice symmetry and multiple sublattices
  • Automated cluster orbit generation respecting crystal symmetry
  • Grand canonical and semi-grand canonical MC ensembles
  • Free energy integration and phase boundary mapping
📄
Thesis Appendix II provides the CASM command-line workflow used to set up the IrO₂(110) surface CE, from primitive cell definition through MC production runs.

Monte Carlo Simulation

Metropolis Algorithm

1. Propose

Randomly select a site and flip σᵢ: 0↔1

2. Evaluate

Compute ΔΩ = ΔE − μ_H·Δσ using the CE

3. Accept

If ΔΩ < 0: always accept. Else: accept with P = e−βΔΩ

4. Sample

After equilibration, measure ⟨N_H⟩, correlations, phase

The Metropolis Monte Carlo algorithm — introduced by Metropolis and Ulam (1949) — samples the grand canonical ensemble without computing the full partition function. Combined with the cluster expansion, it enables thermodynamic averages with near-DFT accuracy at negligible cost per step.

For the IrO₂ hydrogen coverage problem, MC runs use supercells of ~1000 surface sites over 105–106 steps per temperature/potential point, enabling converged phase diagrams and CV simulation.

Zero-Point Energy (ZPE) Corrections:
Hydrogen, being the lightest atom, has substantial quantum-mechanical zero-point vibrational energy. DFT formation energies are corrected by computing vibrational frequencies of adsorbed H via finite differences and adding ½hν per mode. A separate ZPE cluster expansion ensures these corrections are propagated into Monte Carlo simulations.
📄
Thesis §5.8–5.10: MC settings, convergence of hydrogen coverage with simulation cell size, and interpretation of MC snapshots. Appendix VI shows representative MC configurations at different potentials.

Machine Learning in Materials Science


Machine learning has transformed computational materials science by making it possible to learn accurate interatomic potentials, predict properties, and navigate vast chemical spaces — tasks that are intractable with DFT alone.

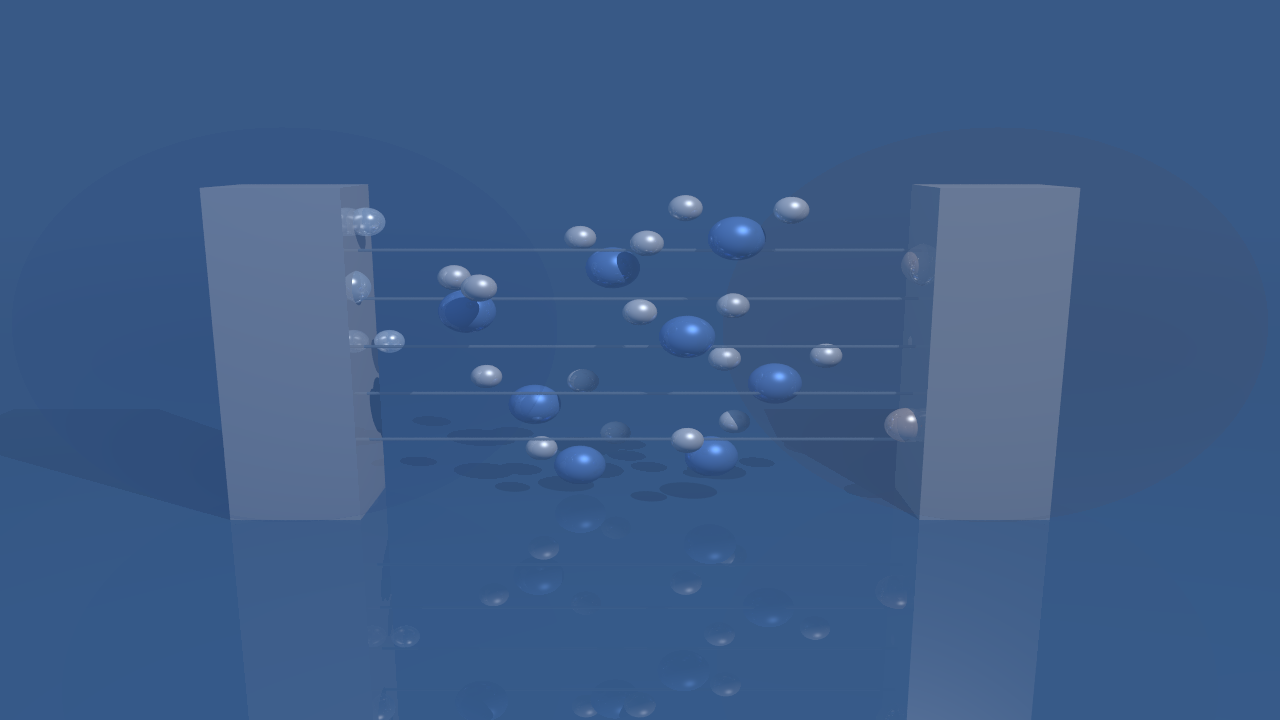
Neural network with Gaussian kernel curve

Abstract visualization of a neural network (input → hidden layers → output) and a fitted Gaussian kernel below, representing ML potential training

ML Interatomic Potentials

Machine-learned interatomic potentials (MLIPs) — such as the Gaussian Approximation Potential (GAP) — learn the DFT potential energy surface from training data, enabling molecular dynamics and Monte Carlo at near-DFT accuracy but many orders of magnitude faster.

GAP uses Gaussian process regression with structural descriptors (SOAP — Smooth Overlap of Atomic Positions) as input features. The covariance (kernel) function measures similarity between atomic environments.

\[ E(\mathbf{R}) \;=\; \sum_{i} \varepsilon(\rho_i) \qquad \hat{\varepsilon} \;=\; K(\rho,\rho') \cdot \boldsymbol{\alpha} \]

ML in Electrocatalysis

The combination of high-throughput DFT, ML, and experimental screening has accelerated catalyst discovery dramatically. Recent highlights include ML-predicted high-entropy oxide catalysts for OER and CO₂ reduction.

🧠

Active Learning

ML models identify which configurations to compute with DFT next, minimizing the number of expensive calculations needed to achieve a target accuracy. Used in generative catalyst discovery workflows.

🔎

High-Entropy Oxides

5+ component oxides span enormous composition spaces (~10⁶ + configurations). ML potentials and surrogate models screen these spaces in hours, identifying promising compositions for experimental synthesis.

📊

Feature Engineering

SOAP, ACSF, and symmetry-invariant descriptors encode atomic structure in ML-friendly representations. Recursive feature elimination (RFE) selects the most predictive subset.

CE + ML for Cyclic Voltammetry Prediction

A key outcome of the thesis is the computation of a theoretical cyclic voltammogram for IrO₂(110) using the cluster expansion + Monte Carlo pipeline. By sweeping the chemical potential μ_H (equivalent to sweeping electrode potential), the simulation yields <N_H>(V) — the H coverage as a function of potential.

The derivative d<N_H>/dV corresponds directly to the capacitive current measured in a CV. Peaks in the simulated CV correspond to potential-driven adsorption/desorption events on specific surface sites.

  • Theoretical CV computed from MC hydrogen coverage sweep
  • Peak positions compared to experimental MBE-grown IrO₂(110) CV
  • ZPE corrections significantly shift peak positions
  • Remaining discrepancies attributed to solvent and temperature effects
📄
Thesis §5.10–5.11: Computed CV compared to experimental data. The agreement validates the CE and confirms the assignment of experimental CV peaks to specific surface phase transitions.
Theoretical CV from Monte Carlo simulation

Schematic CV illustrating the forward (blue) and return (orange) sweeps; peaks indicate surface phase transitions

Experimental Methods

Computational predictions are validated against and guided by experimental characterization techniques that probe catalyst structure and electrochemical behavior under realistic conditions.

Cyclic Voltammetry (CV)

Sweeping electrode potential while recording current reveals surface adsorption/desorption events as peaks. MBE-grown single-crystal surfaces produce well-defined CVs ideal for comparison with theory.

🔭

Molecular Beam Epitaxy (MBE)

MBE grows atomically flat, well-oriented oxide films on single-crystal substrates. Essential for producing model catalyst surfaces with defined composition and crystallography that mirror the DFT slab model.

🌊

In-Situ XAS / SEIRAS

Operando X-ray absorption spectroscopy (XAS) and surface-enhanced infrared spectroscopy (SEIRAS) probe oxidation states and adsorbate species on the catalyst surface in real time during electrochemical reactions.

💧

Dissolution Studies

Online ICP-MS measurements quantify dissolution of Ir and Ru under OER conditions, directly measuring catalyst stability and corroborating thermodynamic stability predictions from surface phase diagrams.